
DYS Decision Support Layer · Data and AI
ANKA BI
Turn organisational data into management insight with interactive dashboards.Track financial, operational and clinical indicators on shared management screens, and discover the trends behind the results with filters, drill-downs and comparisons.
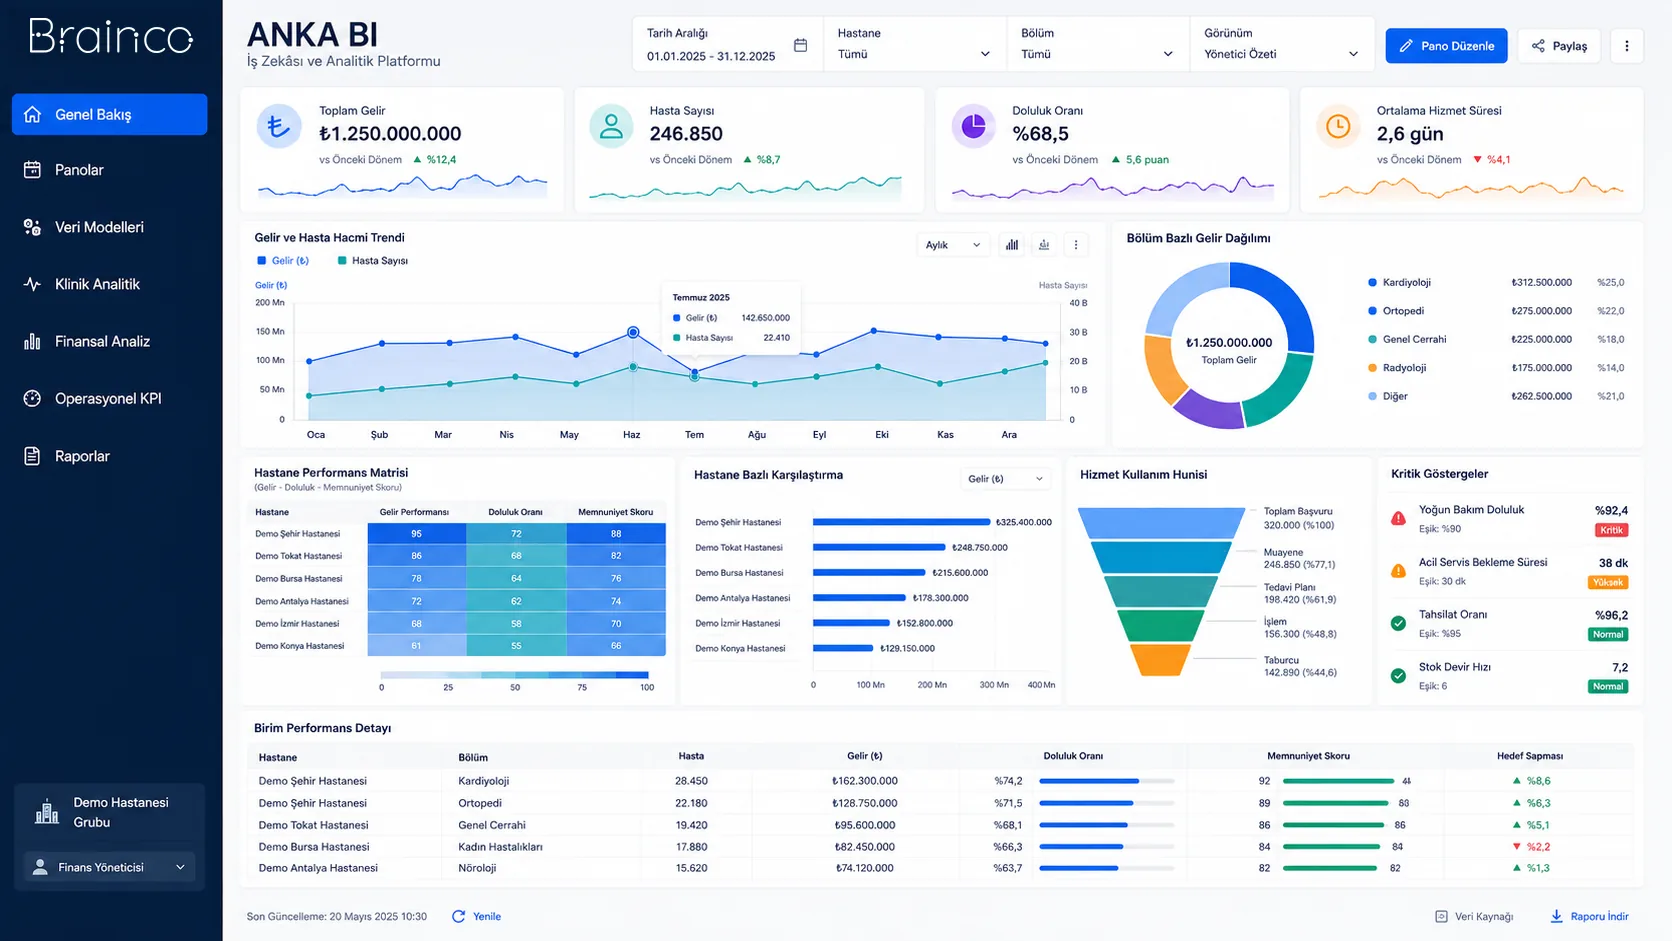
Shared management view
Indicators from different areas come together in the same decision context.
Interactive analysis
Move from the summary view to period, unit and detail breakdowns.
A reliable data foundation
Dashboards are fed by defined and traceable data models.
Need and solution
From a real business need to a manageable process.
Data kept in separate systems and static reports make it hard for managers to assess the current picture together and get to the detail.
ANKA BI organises data in shared models and presents it in interactive dashboards suited to each user’s role, shortening the distance between analysis and decision-making.
Core capabilities
What does ANKA BI offer?
The main areas of work the product covers in day-to-day use.
Interactive dashboards
Track critical indicators on clear, filterable screens.
Cross-domain indicators
Assess financial, operational and clinical measures in a shared view.
Filters and detail
Drill into the data by period, unit and other dimensions.
Periodic trends
Follow changes over time and see where there is room to improve.
Comparative analysis
Compare unit and period results against the same criteria.
Management view
Present decision-makers with summaries suited to their role and responsibility.
How does it work?
A traceable workflow, step by step.
- 01
Connect sources
Authorised data sources are brought in through defined flows.
- 02
Build the model
Indicators are prepared with shared business definitions and a data model.
- 03
Design the dashboard
Views and breakdowns are set to match user needs.
- 04
Explore the data
Results are analysed with filters, trends and details.
- 05
Support decisions
Insights feed into the relevant management and improvement processes.
Benefits and measurable indicators
Track improvement with your organisation’s own data.
Instead of ready-made success rates, make visible the indicators that let you monitor process performance regularly.
- 01Indicator freshness
- 02Dashboard usage frequency
- 03Data refresh status
- 04Unit and period comparisons
- 05Number of detailed analyses
Integration approach
Controlled connection to your existing systems.
The scope of integration is configured around the organisation’s data sources, permissions and technical needs.
Security and governance
Authorised access and traceable actions.
- Role-based dashboard access
- Indicator definition and data source trail
- Organisation-specific data model
- Controlled sharing
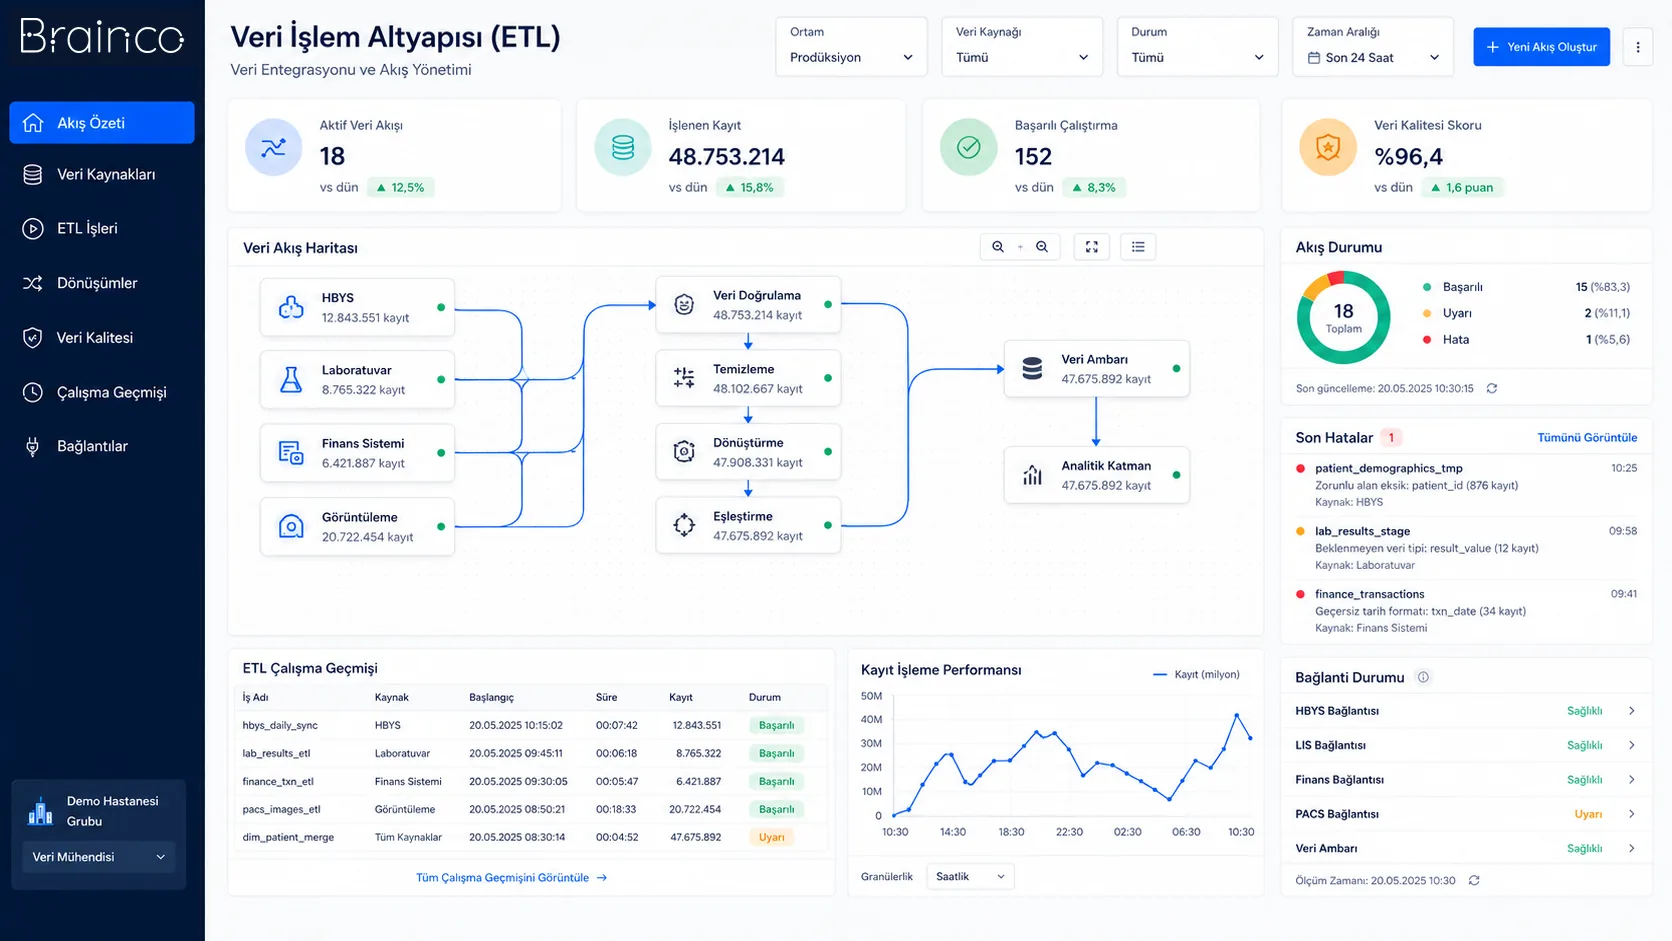
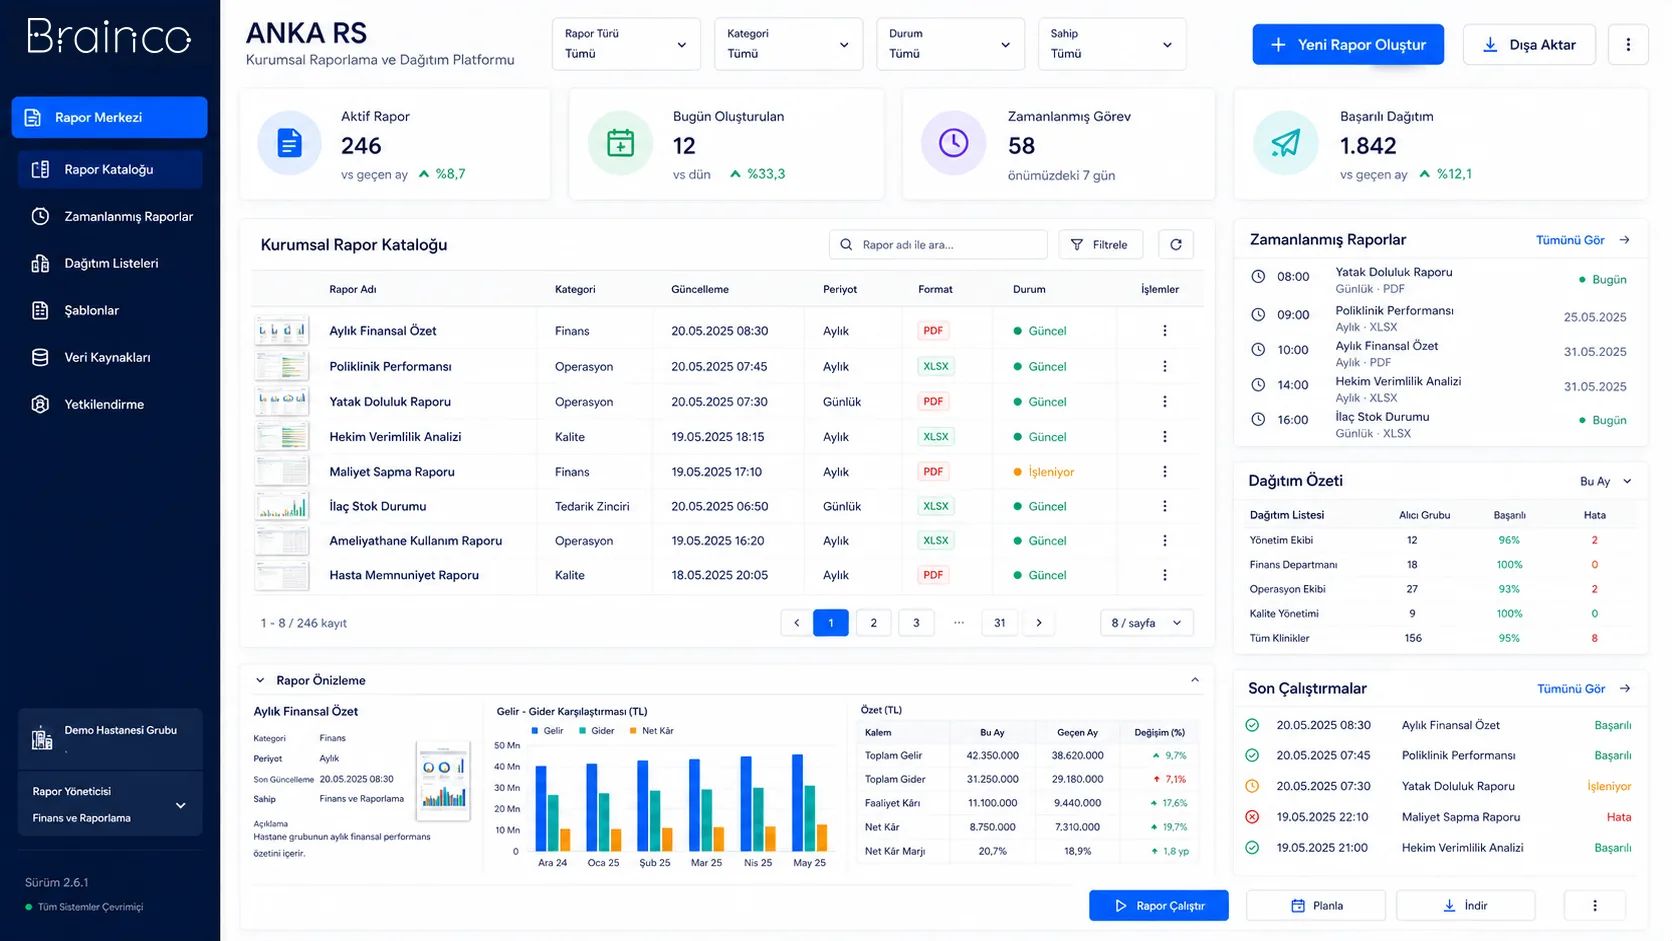
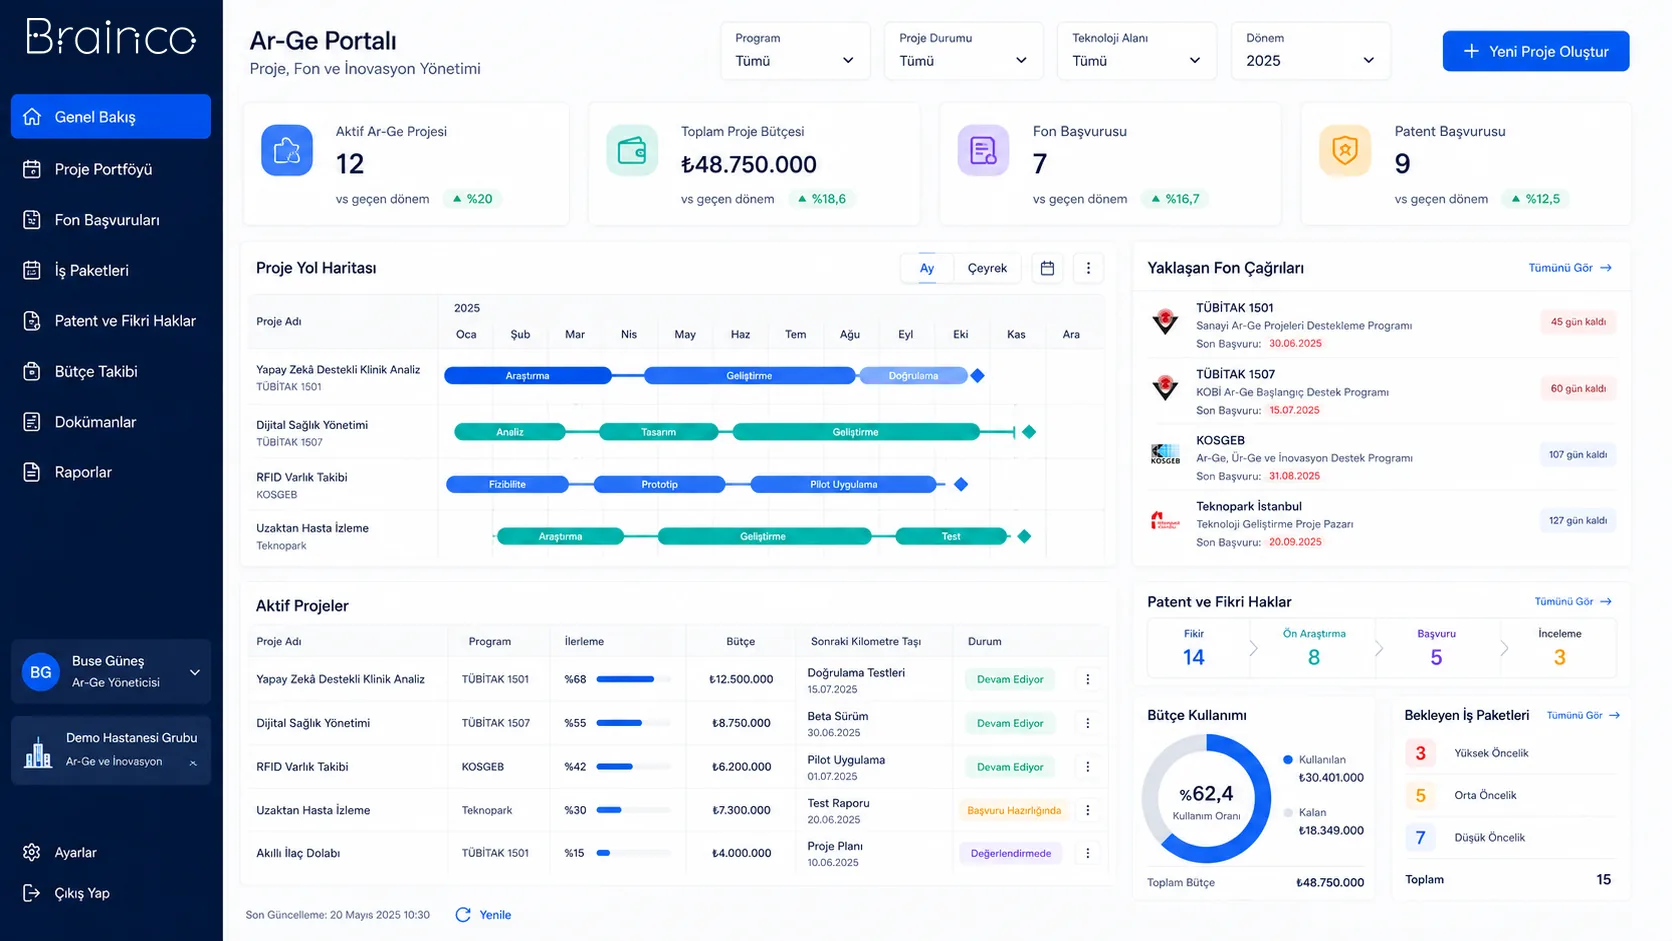
Position in the DYS ecosystem
DYS Decision Support Layer
Let’s evaluate the product together
Turn your organisational data into a clear, actionable management view.
Let’s look at your organisation’s processes, data sources and user needs together.